
Can you believe there’s hardly a minute that passes without someone thinking about pushing a button and eating a bag of corn chips while running a benchmark? It’s true. Even if it only takes two minutes to run the benchmark… two minutes, bag open, bag of corn chips… GONE.
I’ve tackled the hardships of doing just that. My colon is about two chips away from convulsing out my rib cage, so it’s time to put down some results from the cache crushing tests of the HP EliteBook 8740w I’ve been jabbing. It’s packed with 8GB and a NVIDIA Quadro 5000m, so you would think the results would be impressive. We’ll see.
The Benchmark Triumvirate
I’m doing three different test on this HP laptop beast. They all go fairly quick and require very little prep. Perfect for anybody who actually works instead of writing posts about laptop benchmarks. They’re not conclusive, but they did give me numbers quick enough to keep a few IT guys from lapsing into a bandwidth-induced coma. I’ll show you the three benchmarks I ran and where to get the files to run the tests as well. Yippee. Here’s the breakdown:
- 2D and 3D FPS Benchmark
- 3D Feature Rebuild Benchmark
- Large Assembly Benchmark
1. 2D and 3D FPS Benchmark
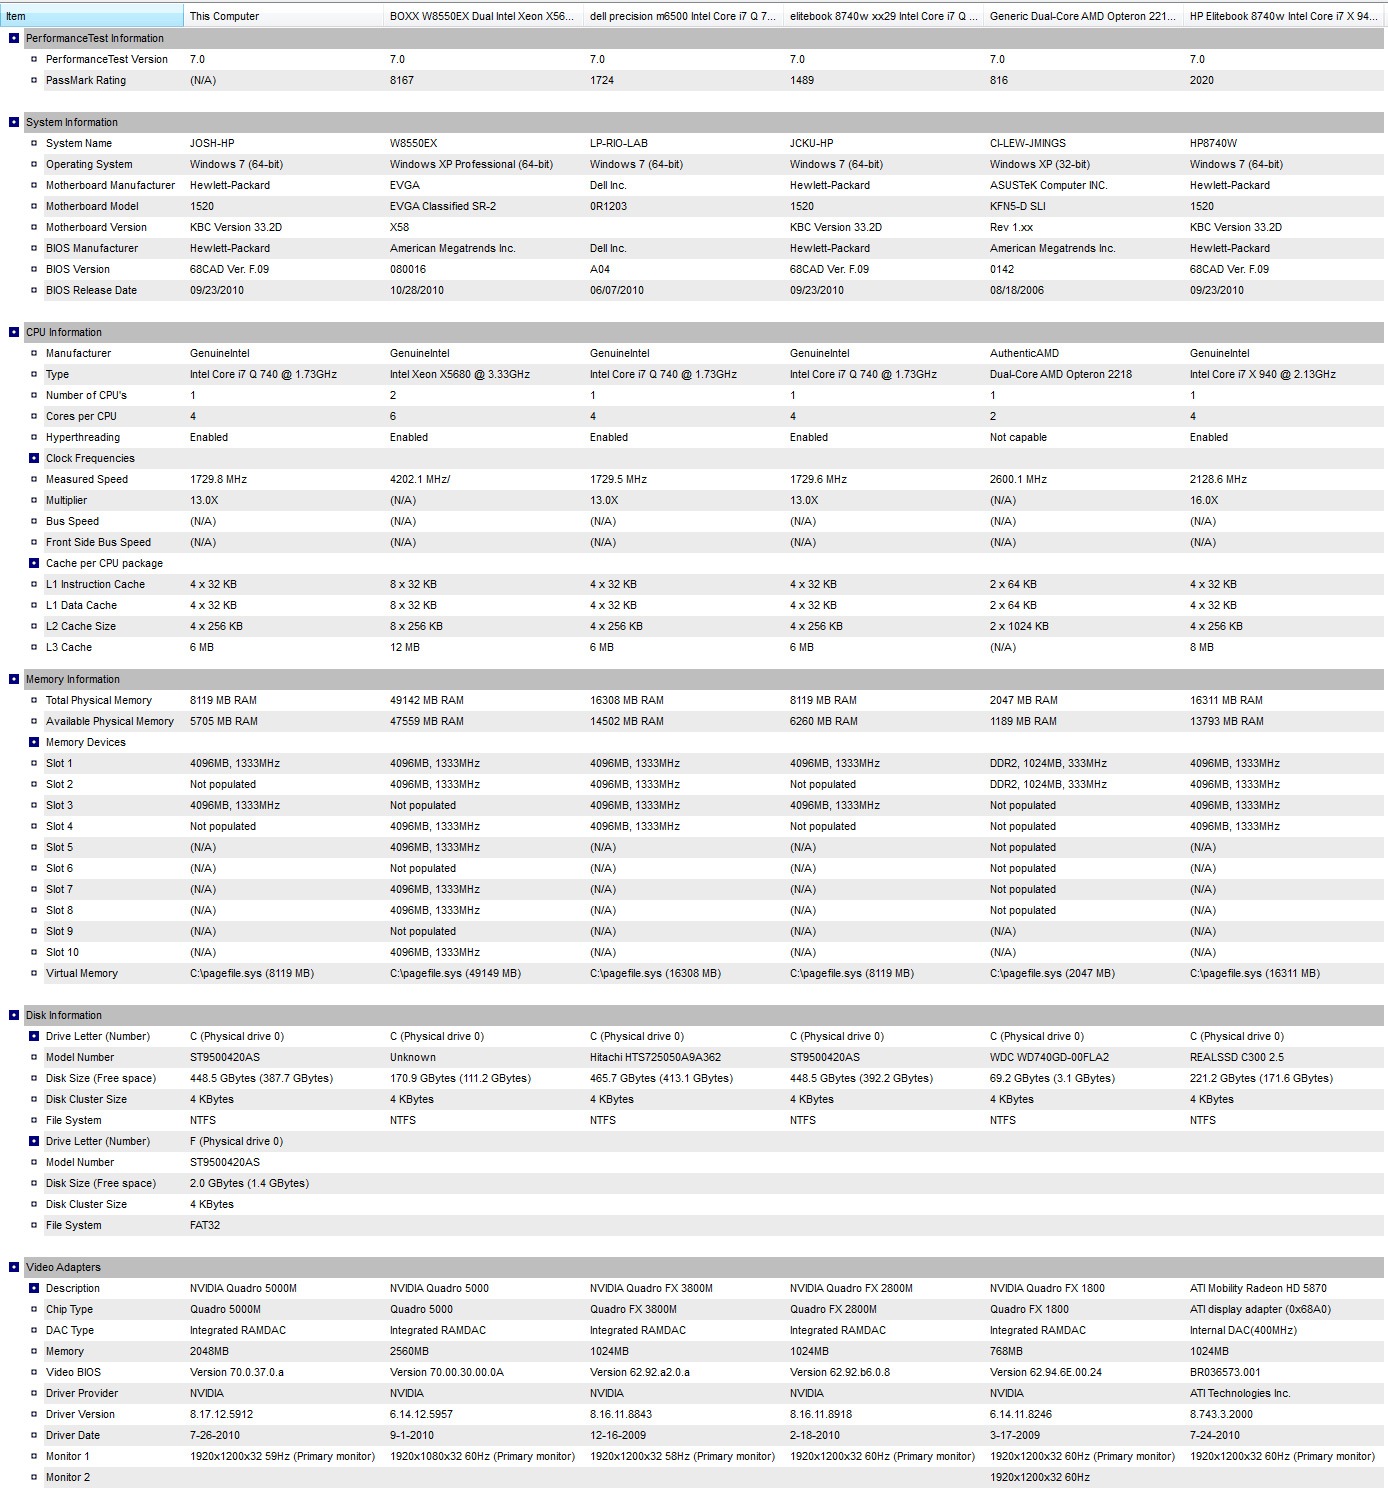
I’m interested most in 2D and 3D performance, but there are four areas I’m testing with this benchmark – overall performance, CPU speed, 2D speed and 3D speed. SPEED… it’s all that matters. I compared the results between the the new HP EliteBook 8740w I have, my old AMD 32-bit computer, a VERY high-end BOXX computer, a HP EliteBook 8740w with a faster processor, another 8740w with roughly the same specs and a DELL Precision M6500 that is very popular with 3D CAD professionals. Here are the results. (The 8740w I’m testing is the Green line (listed as ‘This Computer’ in the results) and my old computer is the Purple line (listed as the Generic Dual-Core AMD in the results) – Click to Enlarge)

System Configurations
Overall Performance
CPU Speed
2D Speed
3D Speed
Results
First, you’ll notice the BOXX computer is literally, off the chart. Understandable with it’s Xeon X5680 3.33MHz processor with twice the cache of the other computers. What I’m focused on is how the HP 8740w compares to what I have and how the 3D compares to the others in general. I added the System configuration above for your reference.
The HP8740w blows what I have, the Generic AMD, out of the freagin’ water. I wasn’t surprised. The AMD computer has is a 32bit XP rig with two tiny GB of RAM. The HP is a 8GB pumpin’ frame cranker that serves up the 3D spectacularly. At an overall 1697 frames per second (FPS) I get nearly twice the power than in the AMD at a mere 716 fps. This pits the NVIDIA Quadro 5000m in the HP up against it’s little brother, the NVIDIA Quadro FX 1800, in the AMD. With an extra 1.2 GB of GPU memory it makes complete sense that the HP will outperform the old custom built AMD I have.
This increase alone makes floating through a model much faster with less degradation when you’re zoomed in tight. The HP beats the others pretty well, except for the BOXX. The FPS results are equivalent with the amount of memory the GPU has. With the HP having 2GB, it’s beating the other 8740’s and the Dell M6500 with only 1GB. I’ve always been a fan of the mid-range NVIDIA Quadro cards… This may have just changed my mind.
Note: These FPS numbers are just for reference and comparables amongst the others. Generally, FPS will not be this high when testing actual 3D CAD models and really, FPS doesn’t matter all that much above a certain threshold. (You’ll see that later on in the Large Assembly Benchmark.) This is simply to compare how one computer reacts to the same data set within the benchmark program.
Do it yourself
For this, I’m using a benchmark put together by PassMark Software called PerformanceTest. It comes with everything you need to run the test, requires no set-up, allows you to compare against your own baslines or that of others and you can use a fully-functional trial to test. It’s great for comparables, but not for testing out 3D CAD models.
Download – PerformanceTest
3D Feature Rebuild benchmark
The SolidWorks Punch Holder model from Anna Wood has become one of the best comparison tools between what hardware you’ve got and what other people have. Looking at the time it takes to rebuild features can be a good test on the complexity of a part and reveal where it could be optimized. The overall rebuild time is what we’re looking at and while this can be different for each run, we’ve grabbed a couple runs to show the range you may see.

Results
| Punchholder Test | |
| Computer | Total Rebuild Time (seconds) |
| Custom Built | AMD Opteron 2.6 GHz, 2GB RAM |
| Run 1 | 175.81 |
| Run 2 | 170.95 |
| HP EliteBook 8740w | Intel Core i7 1.73 GHz, 8GB RAM |
| Run 1 | 84.6 |
| Run 2 | 83.21 |
On this test, you open the model, perform a force rebuild in SolidWorks (Ctrl-Q) and then look at the rebuild times for the features in the model (Tools, Feature Statistics). As you can see above the HP 8740w outperforms the old AMD I have and again, no surprise, with the AMD being an old 2GB 32-bit XP machine. Still, it shows me I get 52% decrease in rebuild times which, as you may know, will be a big help. How does it compare to other computers? You can view Punch Holder results to compare how your computer performs with others. It’s not split into laptops or desktops, so you’ll have to fish around a bit. The very best is a homebuilt 64-bit system running an overclocked Core i7 EE975, 6GB RAM and GTX285 SLI GPU. It comes in with a time of 45.3 seconds. Beefy. There are no other HP 8740w listed, but the closest similar setup is a DELL M6500 with 16GB of RAM that scored 77.72 seconds. Overall a good test to compare between what you have and what you had.
Do it yourself
The punch holder model is available directly on Anna’s site. Just download and follow the instructions to see what your rebuild times are.
Download – Punch Holder
3. Large Assembly Benchmark
There’s nothing like a big ol’ assembly to show you what your hardware is capable of. For this test, I used a data set of a A340 Aircraft Galley. This model has a total count of 5, 847 components with 375 unique parts and 115 unique sub-assemblies. This may actually be considered a mid-sized assembly for some, but whatever the classification, it brings a 2GB 32-bit system to a crawl, even with heavy optimization and configuration management. For this test, I’m using a simple macro, called Spin500, that rotates a model 500 times. Big thanks to Greg Corke from Develop3D for providing the macro. Here are the results.

Results:
| Large Assembly Performance | ||
| Computer | Total Time (seconds) | FPS |
| Custom Built | AMD Opteron 2.6 GHz, 2GB RAM | |
| Run 1 | 136.38 | 3.67 |
| Run 2 | – | – |
| HP EliteBook 8740w | Intel Core i7 1.73 GHz, 8GB RAM | |
| Run 1 | 26.26 | 19.08 |
| Run 2 | 118.91 | 4.21 |
Run 1 – Shaded with edges only
Run 2 – Shaded with edges, Realview, transparency, shadows, perspective
Once again you can see the drastic difference between the older AMD computer and the new HP 8740w. Nothing unusual… except for when you turn on every possible visual option there is. Doing this slowed the powerful HP down to near the level of the old 2GB, 32-bit computer. Nothing like some transparency and perspective to crush the dreams of a puffed-up processor. However, what’s interesting is that even though the FPS was decreased on the HP when all the visual options were cranked up, it remained easy to work in, even to the point of editing sub-assembly parts several levels down.
Do it yourself
The Spin500 macro is a quick and easy test to run against your dataset on different computers. In SolidWorks, just open your model, select Run Macro from the Macro toolbar and select the Spin500Mouse.swp file.
Spin500Mouse
Conclusion
I actually really enjoy doing these benchmarks, especially between two vastly different computers. All of these are quick and easy. You see a lot of different test and benchmarks out there, but really, in an engineering office where IT is often allowed to strap you to a motherboard and beat you senseless with specs, all you need is some quick, simple ways to evaluate what you and your cohorts in engineering design need. These three methods may not be the most comprehensive, but they give you a great baseline to compare other set-ups to. It also goes to show you that FPS is not always the major criteria to evaluate.
With the HP 8740w, even thought the model visuals were all turned on, the model was still usable. I was able to move around, rotate, zoom and perform edits with very little decrease in the ability to do so. The one area that is always affected by increased load to the GPU is selection. When working with all visual options activated, selection of model edges slows down and command response rate decreased. Not enough to make it impossible to work, but enough to make it slow you down if you know how to use the 3D modeling program interface. However, with that load taken off the GPU, selecting model edges, faces and points is no issue at all.
So, the same advice follows for a high-end computer as it does for a lower end computer when working with 3D models. Of course, this is going to vary slightly across different modeling systems, but generally, if you want to work faster, make sure your reduce the amount of load on the GPU by reducing the amount of visual setting you have enabled.


